

When most people think of Antarctica, they tend to think of penguins. Antarctica’s great size and the harshness of its coastline has made it difficult for researchers studying penguins to accurately estimate how many of them there are in the Antarctic. From satellites and field research, scientists have been able to come up with unique ways to track penguin groups as they move and grow in this harsh region.
Satellite imagery has become a crucial tool for ecologists and conservationists to map and monitor wildlife populations in remote or inaccessible areas. For Antarctic researchers, it provides a particularly valuable method for studying penguin colonies. With the help of satellites, researchers can now track colonies of penguins and find previously unknown groups by imaging their guano.
Research using satellite imagery to map penguin colonies
The 2020 study published in Remote Sensing in Ecology and Conservation highlighted the discovery of 11 new emperor penguin colonies in Antarctica. Researcher identified these penguin colonies by using satellite imagery from the Copernicus Sentinel-2 mission.
This discovery raised the global count of known colonies to 61 and increases the estimated number of breeding pairs to between 265,500 and 278,500. Despite the harsh and remote conditions of Antarctica, where temperatures can drop to –50°C, scientists from the British Antarctic Survey have successfully utilized guano stains visible in satellite images to track penguin populations.
The newly discovered colonies are small and located at the margins of the emperor penguins’ breeding range, areas vulnerable to climate change, which poses a significant threat to their habitats and survival. The study’s findings are important for monitoring the impacts of environmental changes on this species, known for its susceptibility to global warming.
Using satellite imagery to track penguin population changes over time
Led by researchers from the University of Minnesota, a 2024 paper published in Proceedings of the Royal Society B used high-resolution satellite imagery, aerial and ground surveys, and Bayesian modeling to study the population dynamics of emperor penguins over a decade. Covering the entire range of the species from 2009 to 2018, the study used very high resolution (VHR) satellite images to detect penguin colonies, which are distinguishable by the contrast of guano on ice.
These satellite images, along with data from aerial surveys and ground validations, were used to estimate the number of adult penguins present during the breeding season each year. The analysis also used Bayesian state-space modeling to integrate these data sources to provide a detailed view of population trends at multiple spatial scales, from individual colonies to global trends.
The study found a significant decline in the global population of emperor penguins, with an 81% probability that the population in 2018 was lower than in 2009, showing a median decrease of 9.6%. This translates to a decrease of about 24,000 adults over the ten years. The study also indicated a global annual population decline rate of 1.3%.
Interestingly, the data showed variability in population trends across different regions, with some areas showing stability or even increases. This suggests that regional environmental conditions, particularly changes in sea ice, play a critical role in influencing penguin populations.
What was the first research to use satellite imagery to count penguin populations?
In 2014, NASA researchers published the results the journal PLOS of using Landsat 7 satellite imagery on Antarctica’s penguin population to estimate their numbers based on the large guano stains left behind. Since researchers can’t possibly get to every penguin colony on the continent, they came up with the idea of using satellites to track the most obvious marker of a penguin colony- their poop.
Difficult to reach because of unstable sea ice, satellites are able to see the penguin colonies and have the images confirmed by researchers familiar with the areas in question. Using these methods, thousands of new penguins have been added to the Antarctic penguin population in recent years.
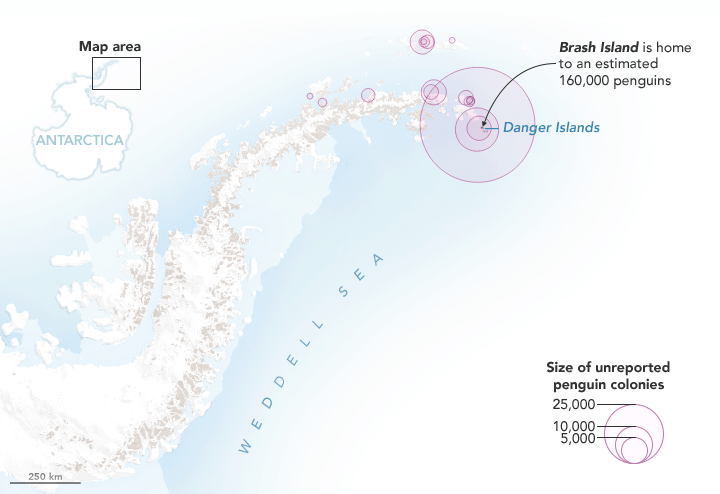
Through the use of Landsat 7 imagery, researchers have counted an additional 166,000 penguins on Brash Island, 23,000 on Earle Island, and 7,000 on Darwin Island. New colonies of penguins, larger than most found on the Antarctic continent, have been found off the coast on a series of islands named the Danger Islands.
How satellite images are used to find guano
Satellite images that are looking for signs of penguins will show pinker areas that have been covered in penguin guano. Bare rocks don’t appear to have that color naturally, making it a bit easier for scientists to determine if there is a group of penguins living nearby. Using color data from areas researchers have been to and tracked penguins, they are able to teach the satellite image to analyze new locations for those particular guano colors.
A computer algorithm matches areas on remote islands with known areas of penguin colonies on visited islands. This allows the image analysis to make an educated guess on where penguin colonies may be, without ever having to send a researcher into a dangerous area of the continent.
All of the data on penguin colonies from Landsat 7 imagery analysis is deposited into the open access MAPPPD (Mapping Application for Penguin Populations and Projected Dynamics).
Smaller penguin colonies may go unnoticed because the resolution of satellite imagery can’t always detect smaller guano stains. However, scientists estimate that they can identify penguin colonies with about 3,000 breeding pairs approximately 50% of the time.
Most of the penguins living in the Antarctic live in larger colonies, so researchers estimate that they can detect 97% of the penguins there.
References
Fretwell, P. T., & Trathan, P. N. (2021). Discovery of new colonies by Sentinel2 reveals good and bad news for emperor penguins. Remote Sensing in Ecology and Conservation, 7(2), 139-153. DOI: 10.1002/rse2.176.
Larue, M., Iles, D., Labrousse, S., Fretwell, P., Ortega, D., Devane, E., … & Jenouvrier, S. (2024). Advances in remote sensing of emperor penguins: first multi-year time series documenting trends in the global population. Proceedings of the Royal Society B, 291(2018), 20232067.
Lynch, H. & Schwaller, H. (2014) Mapping the Abundance and Distribution of Adélie Penguins Using Landsat-7: First Steps towards an Integrated Multi-Sensor Pipeline for Tracking Populations at the Continental Scale. PLOS.
Penguin Droppings Are Fertile Ground for Science, NASA, June 13, 2017
Help Scientists Understand Penguin Populations by Tagging Photos
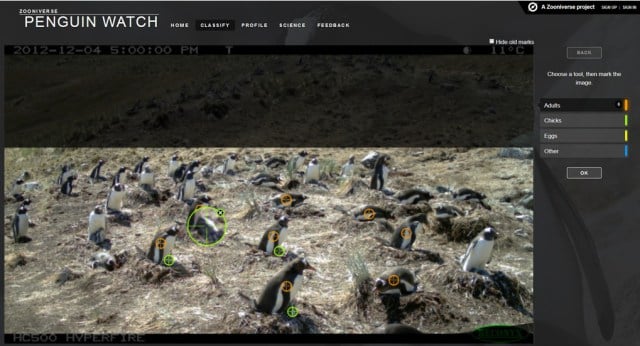
Scientists have set up remote cameras across the Southern Ocean in order to monitor penguin colonies. Through Zooniverse, a crowdsourcing web site has been set up to encourage citizen scientists to tag the tens of thousands of photos:
Penguin populations are declining but the harsh conditions of the Antarctic make monitoring them logistically challenging. Researchers from around the world have established a remote camera network to monitor penguin colonies across the Southern Ocean. By tagging images from these cameras on Penguin Watch, you can help scientists understand how and why penguin populations are declining – and how to best protect them.
Penguins play an important role in the Antarctic ecosystem and are considered sentinels of change – any variations in penguin dynamics may reflect larger changes to the environment. Climate change, fisheries, disease, and pollution are all prime suspects in driving penguin population decline. Penguin Watch will help the researchers understand more.
Users who want to contribute are taken through a short tutorial in order to understand how to individually tag adult penguins, chicks, and eggs from photos taken at nesting sites. Users should also mark any animals that are near the nesting sites.
To participate visit: www.penguinwatch.org.
This article was originally written on December 30, 2017 and has since been updated.
See Also
Fonte : National Geographic


 ha abolito il finanziamento ai partiti")


