

Georeferencing, in the context of GIS, is a process used to associate a scanned or paper map with real-world geographic coordinates. When a paper map is scanned or digitized, it becomes a raster image that lacks geographic coordinates. The primary purpose of georeferencing is to align the map image accurately with a spatial reference system.
Georeferencing scanned maps also makes it possible for GIS users to be able to digitize information directly from the digital copies and capture geographic coordinates in the process.
The easiest way to georeference a scanned map, as seen in the previous tutorial on georeferencing in QGIS, is to key in coordinates based on grid lines on the map. These grid lines have latitude and longitude values associated with them so you can simply drop control points at the intersections of these lines and key in the correct latitude and longitude values.
What do you do if the map doesn’t have grid lines? Georeferencing a map without grid lines is still feasible using recognizable features and reference GIS data to associate the coordinates. In other words, to georeference a map, control points on the scanned map are associated with reference points from a dataset, which contains known geographic coordinates. These reference points are typically located at identifiable features like road intersections, landmarks, or buildings.


Learn how to georeference a scanned map using GIS data
This GIS tutorial will take you through the steps to georeference a scanned map available from the U.S. Library of Congress that shows the immediate neighborhood of the U.S. Capital building by tying points on the map with coordinates extracted from OpenStreetMap map tiles. For this tutorial you will need to have QGIS already installed on your computer.
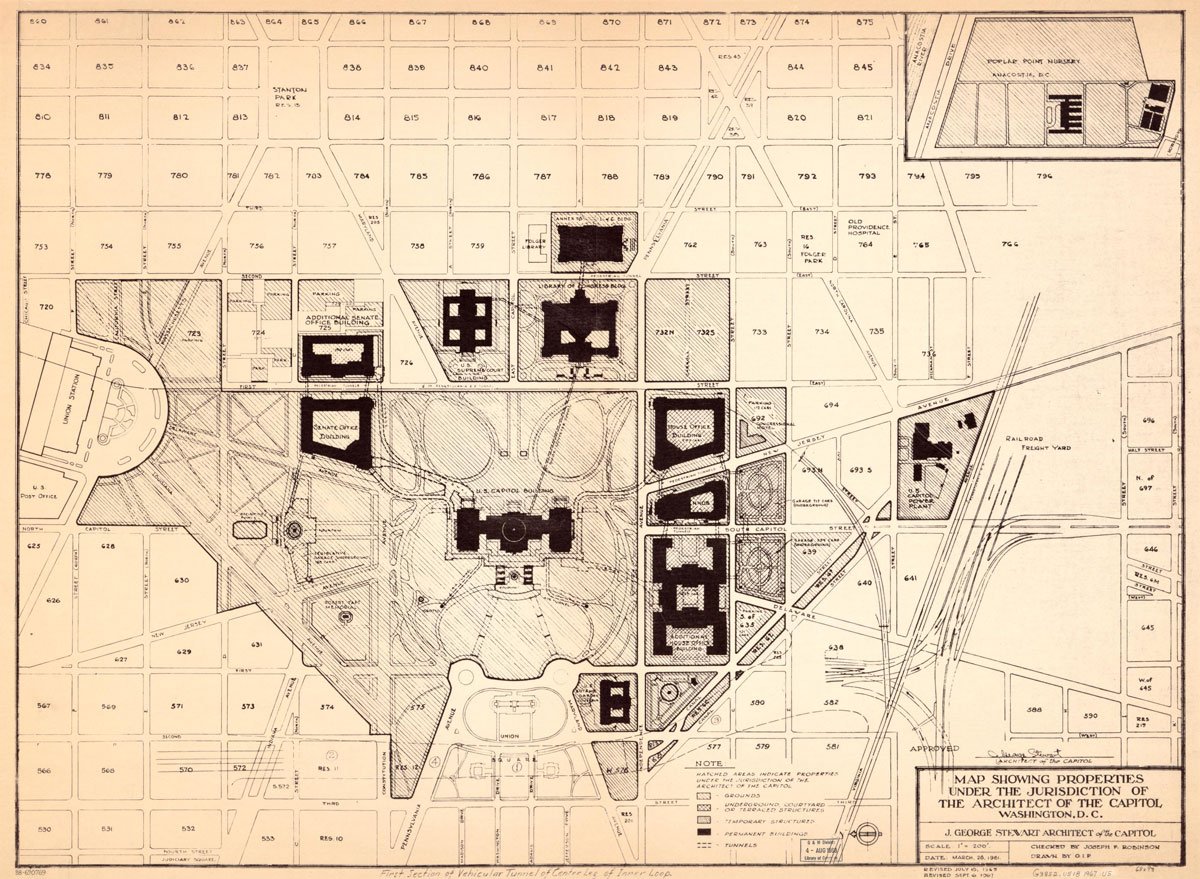
You will also need internet access so you can retrieve this 1967 map entitled, “Map showing properties under the jurisdiction of the Architect of the Capitol, Washington, D.C.” and retrieve a pair of coordinates from Google Maps.
Load OpenStreetMap into a QGIS project
To get started with this GIS tutorial, launch QGIS and start a new project. The first step is to load the base layers that you will use to as the reference dataset for the geographic coordinates that you will apply to the scanned map. The base layers that you will add are OpenStreetMap map tiles.
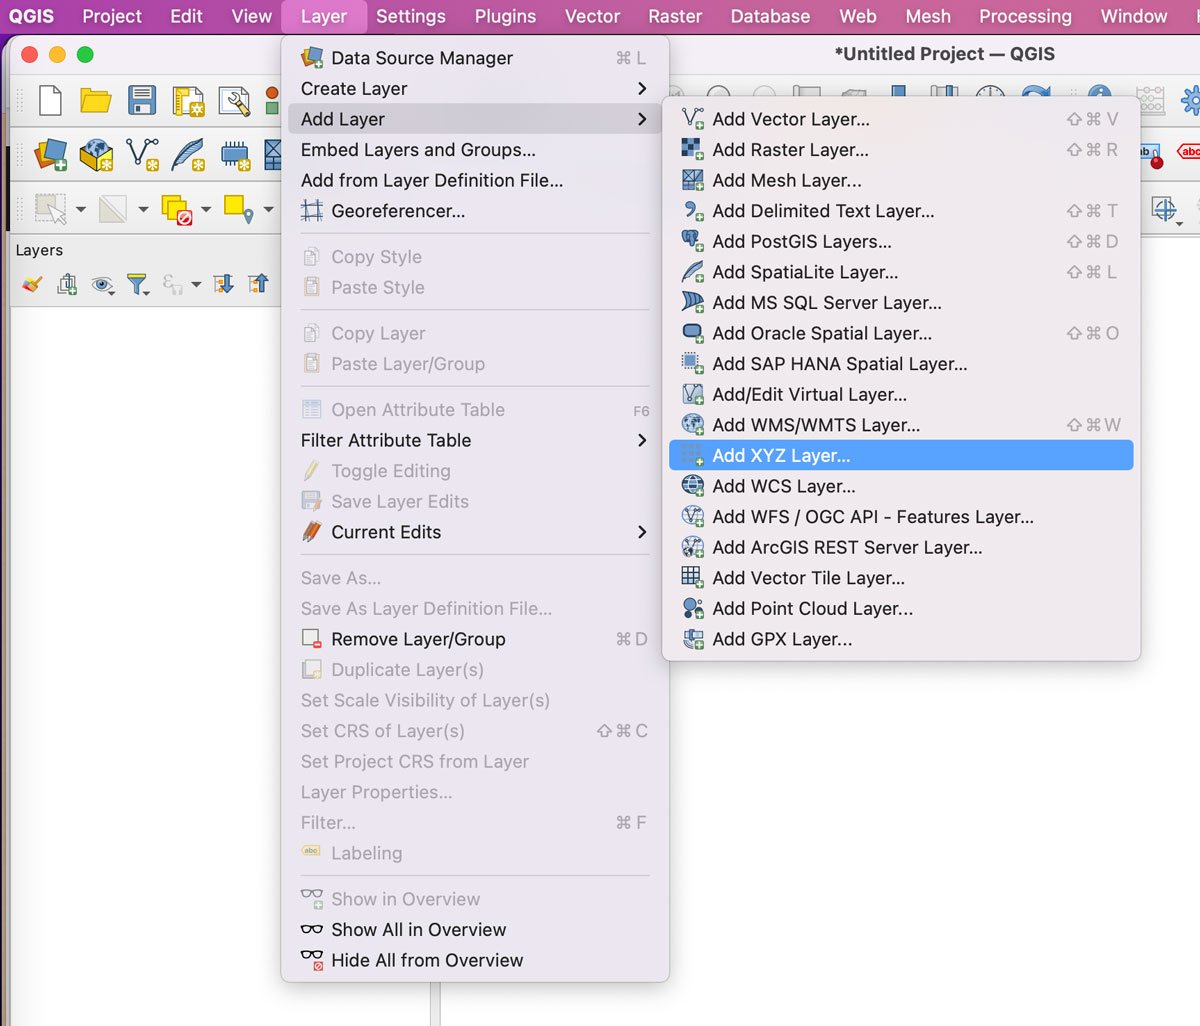
To add the base layer, go to Layer –> Add Layer –> Add XYZ Layer. Select “OpenStreetMap” from the Data Connections drop down.
Under connection details, copy and paste in this URL: https://tile.openstreetmap.org/{z}/{x}/{y}.png and click “Add” and then “Close” to return to the map canvas view where you should see OpenStreetMap in the layers panel and a zoomed out view of the data.
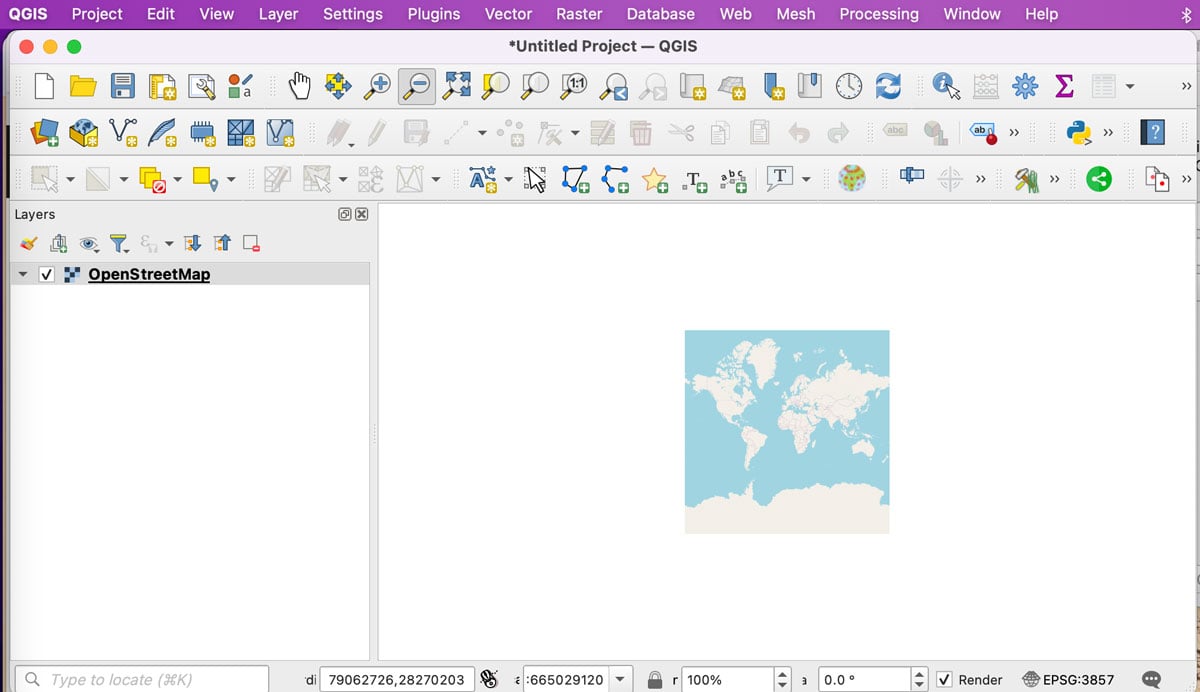
Now that you have base data added to QGIS, you can use this instance of OpenStreetMap to tie geographic coordinates to the scanned map. The default map view of this data is a very zoomed out view of the world.
For the OpenStreetMap data to be useful for your georeferencing purposes, you will need to change is the scale and centering of this data so your map view is a very close up view of the area around the U.S. Capital building to match the extent of the map (below) that we want to georeference.
Zoom to the area of interest in the QGIS Map Canvas
There are two ways for you to zoom in to the area of the scanned map. The first is to use the pan and zoom tools. This method doesn’t require any additional plugins and can work quickly if you know exactly where in the world you are wanting to focus.
If zooming in to the geographic area using the pan and zoom method would require too much hunting and pecking, the alternative is to use coordinates extracted from an external mapping source and then a QGIS plugin that will let you plug in those coordinates and zoom to the area of interest for you.
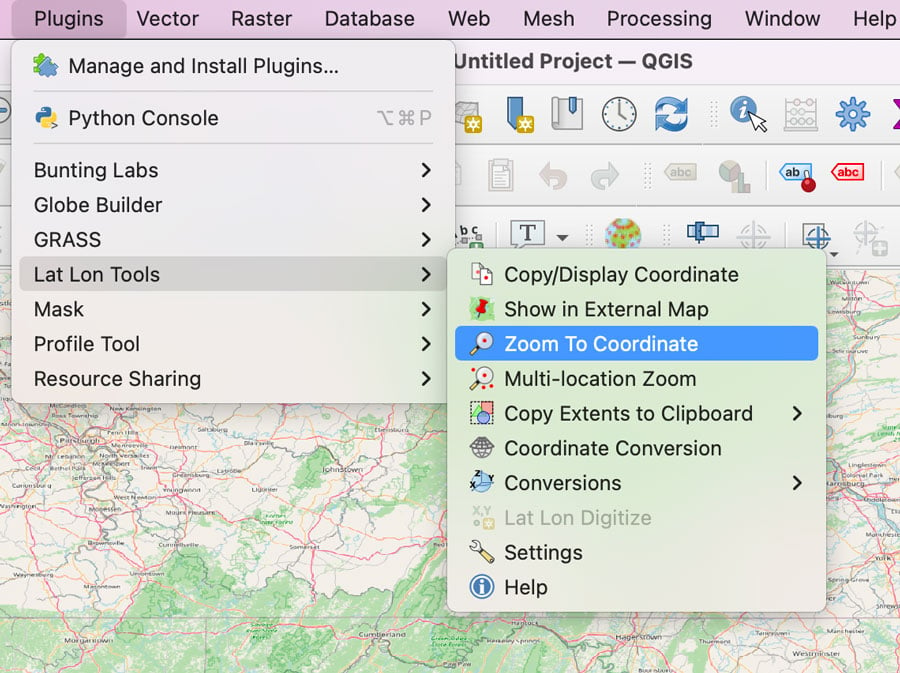
To do this, install a plugin called “Lat Lon Tools” that offers a “Zoom to Coordinate” function. Go to Plugins –> Manage and Install Plugins. In the interface that appears, type in “Lat Lon” to find the plugin.
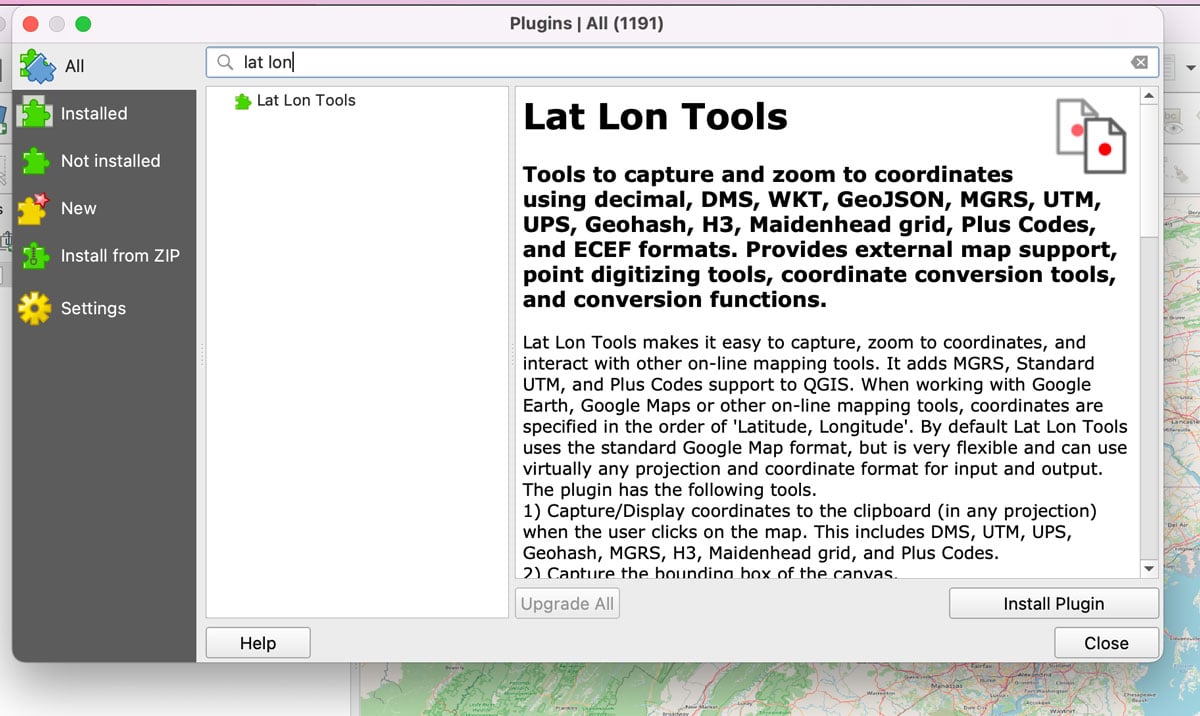
Once you find the plugin, click on the plugin name and click on the “install” button to add it to your QGIS project.
Now you will need the pair of coordinates that corresponds to the geographic location of your map. Head to Google Maps and in the search box, type in US capital building and select the result for Washington, D.C. Click enter to zoom into that location.
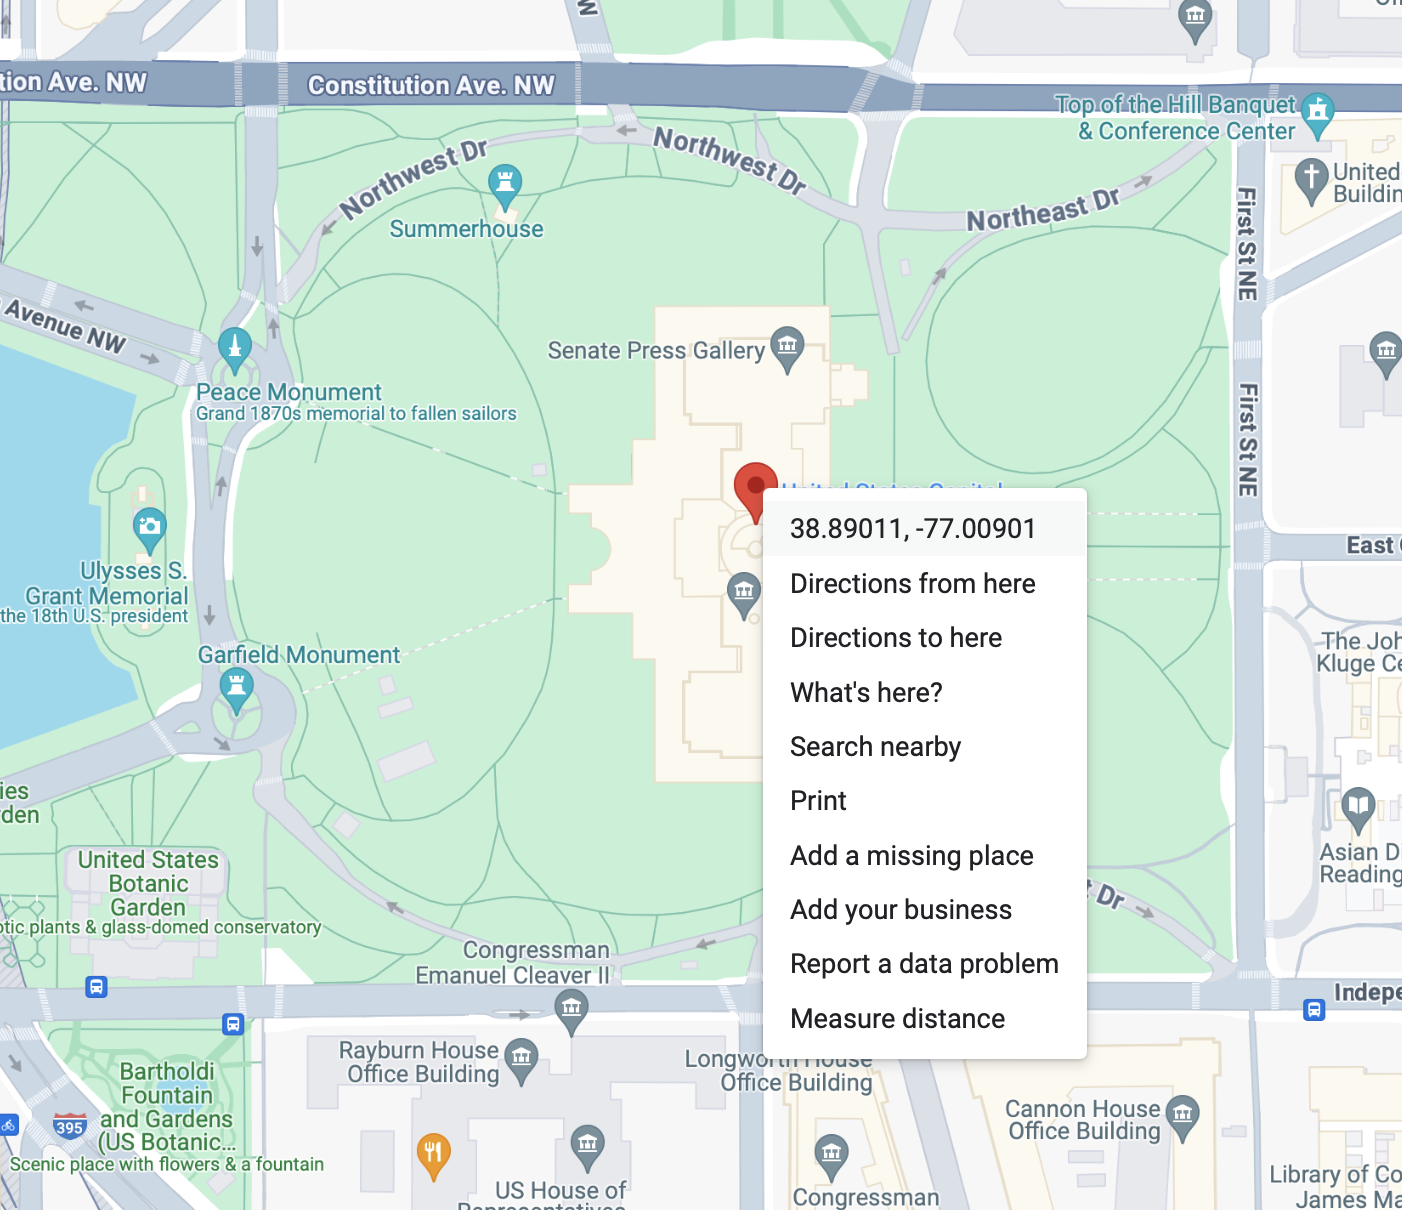
Click on the red map icon marking the spot of the capital building and right click to bring up the menu item for that location. The first entry in the menu is a pair of coordinates. Click on those to copy those coordinates to your computer’s clipboard.
Next, go back to the QGIS project and select Plugins –> Lat Lon Tools –> Zoom to Coordinate. The interface for this tool will appear in the lower left corner of your map project.
The Zoom to Coordinate tool lets you copy and paste a pair of coordinates into the search box. While many GIS software tools list the X (longitude) value first, followed by the Y (latitude) value, Google Maps presents coordinates in latitude, longitude order (Y,X).
So, before you copy and paste the coordinates from Google Maps, you will need to switch the order by clicking on the “Toggle Coordinate Order” button represent by the small icon with the letters “X,Y”.
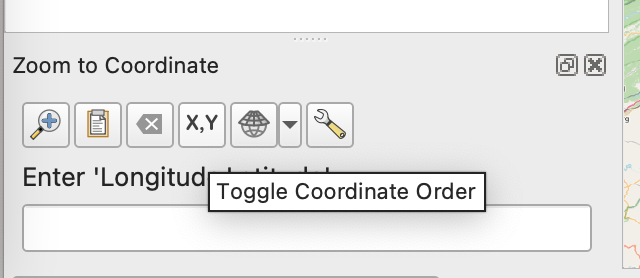
Once you have clicked the “X,Y” button, the letters will reverse to “Y,X” and with the text “Enter ‘Latitude, Longitude”. Paste in the pair of coordinates that you copied from Google Maps and hit the enter key on your computer. The map will now display centered on Washington DC with a red cross marking the spot of the U.S. Capital building. Click the magnifying glass with the + tool to zoom in further until the extent of the map view matches the map.
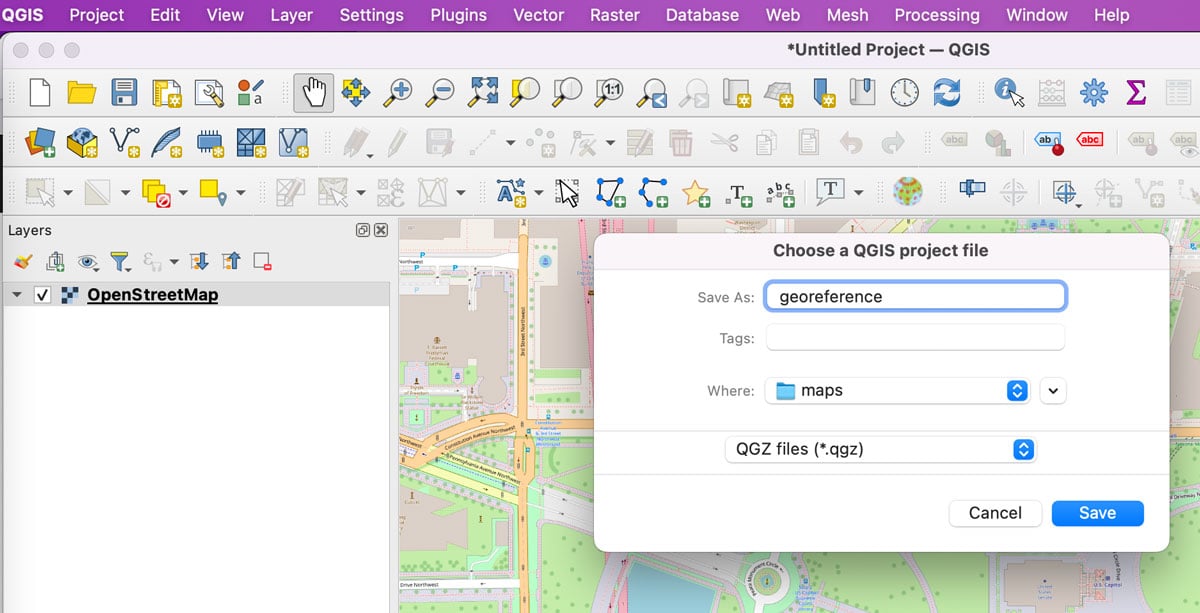
Now that you have the map view primed to help you with the georeferencing task, it’s a good time to save the project to preserve the work done so far to set up the QGIS map view. Go to Project –> Save to pull up the interface where you can set the project name and select the folder where you want it saved to.
Add the scanned map to georeference to QGIS
Now you are ready to move on to the next step which is to set up the scanned map so you can start assigning coordinates to points on that map.
First, retrieve this scanned map from the Library of Congress site: “Map showing properties under the jurisdiction of the Architect of the Capitol, Washington, D.C.” Underneath the image view, select a higher resolution jpeg and click “Go”. You will be zooming in to this map to more precisely place control points and there will be too much pixelation with lower resolution maps.
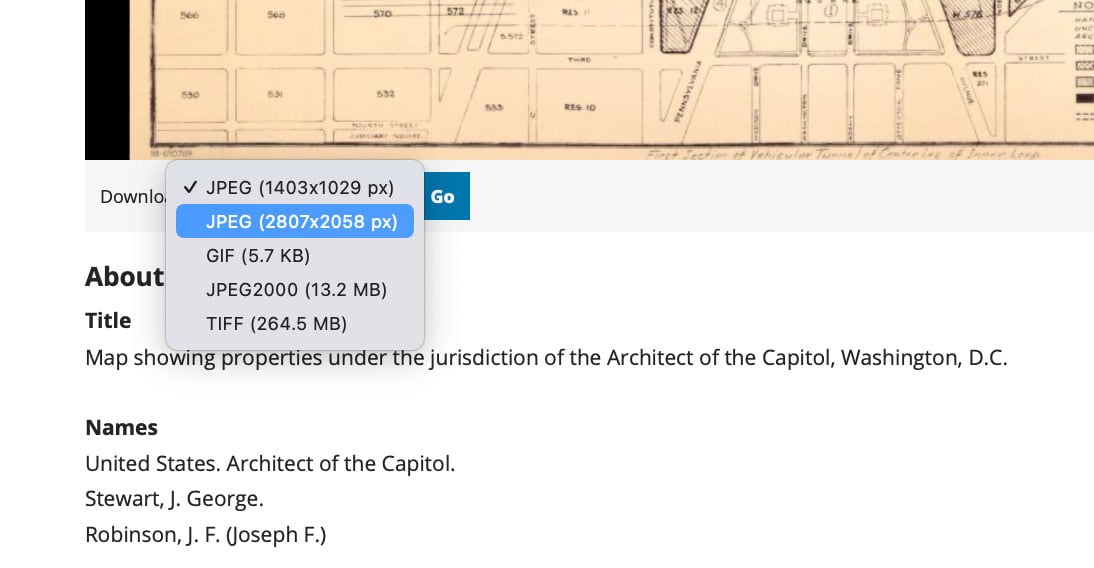
A second browser tab will open (you might have to allow “popups” to enable this). Right click on the image and choose a location on your computer to save the scanned map.
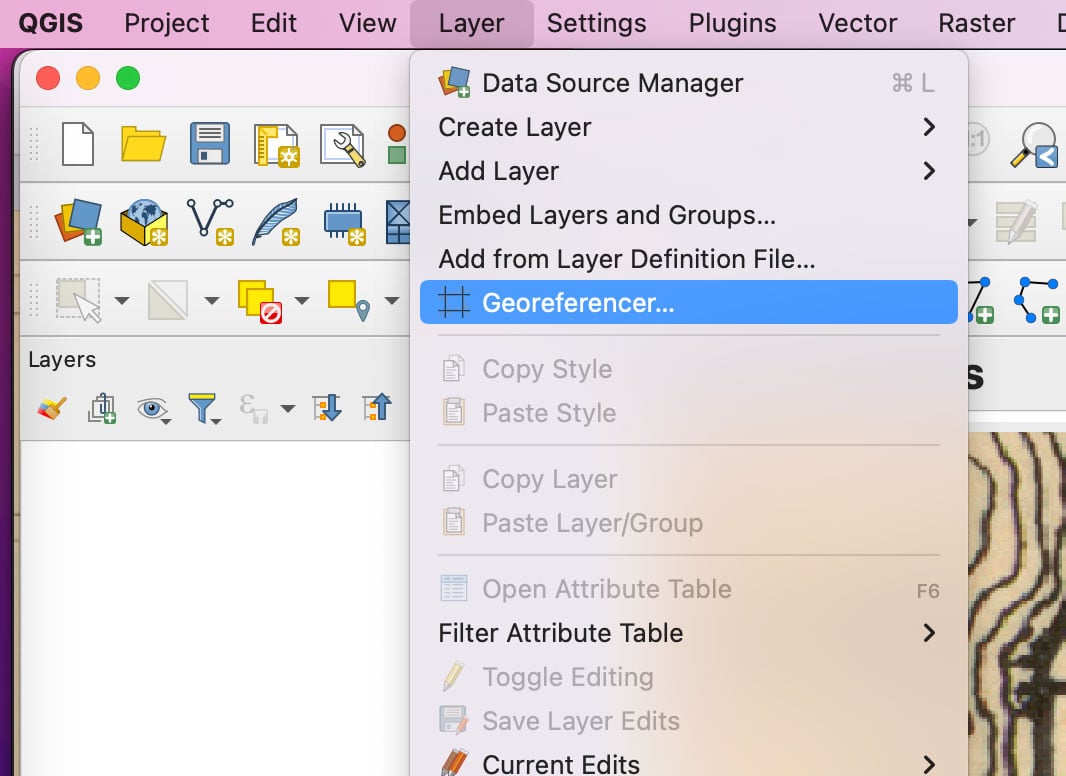
Go back to your georeference QGIS map project and select Layer –> Georeferencer from the main menu.
In the Georeference window that opens, click on the “Open Raster” button (looks like a checkerboard) that is located to the far left.
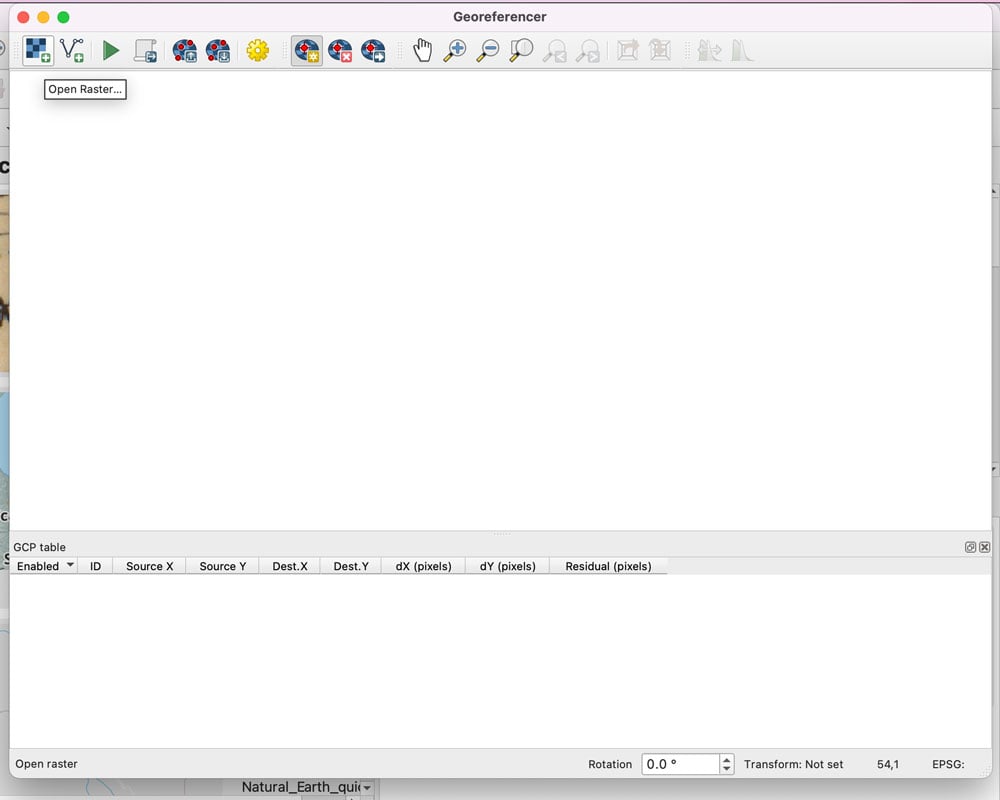
Locate the U.S. Capital building map on your computer and select it to add it to the georeferencer window.
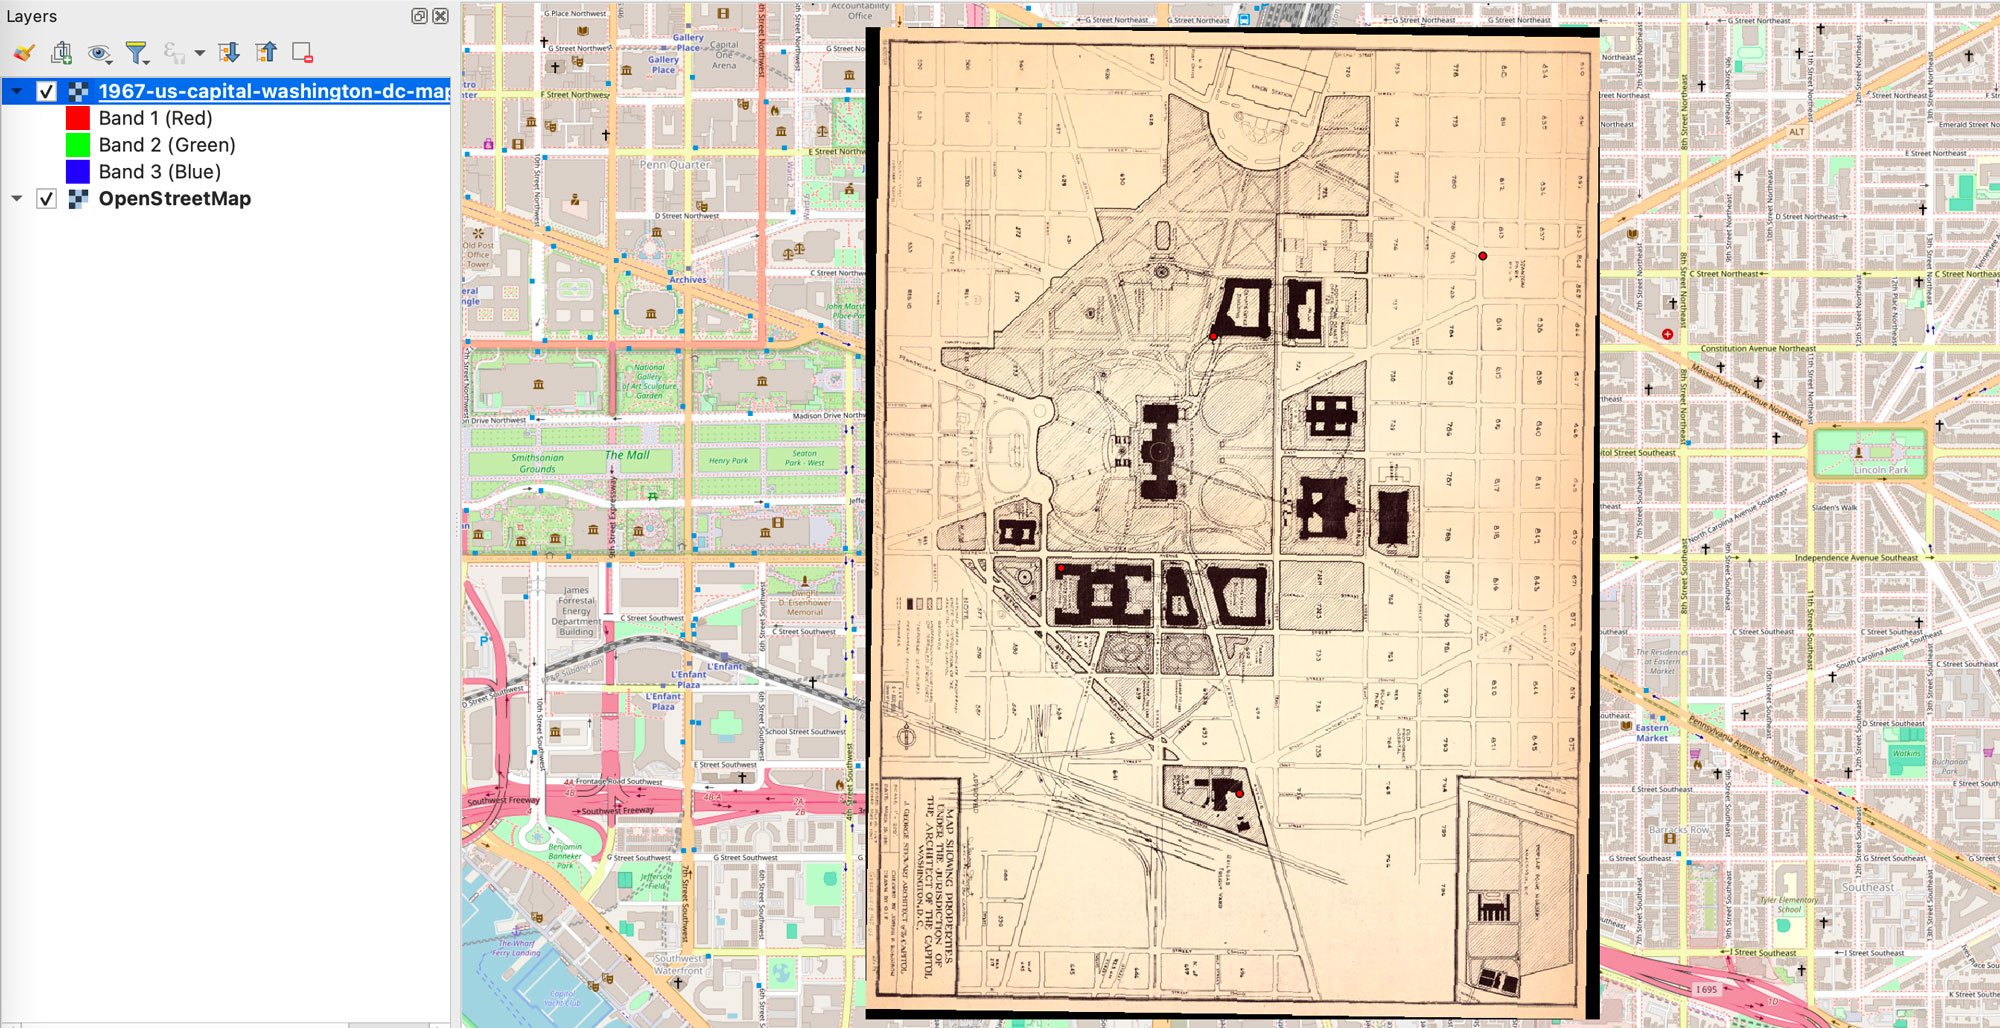
Next resize both the QGIS map canvas view and the Georeferencer window so they can sit side by side. This will make it easier for you as you toggle back and forth to set the control points.
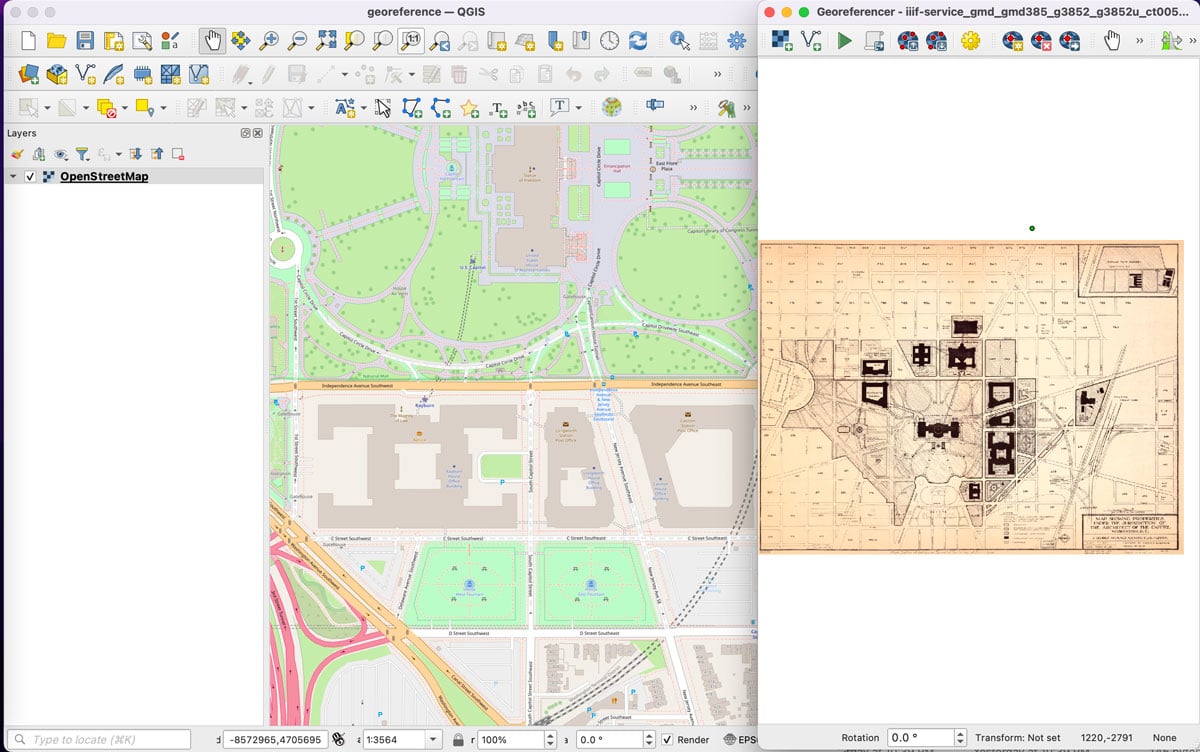
Seeing the OpenStreetMap and the scanned map side by side also lets you see that the map orientation of the scanned map is not the same as the OpenStreetMap data. North on the scanned map is to the left and east is towards the top of the map. If you find the different orientation confusing, you can always first rotate the map in an image software program so north is at the top and then add it to the Georeferencer window.
Adding control points to the map
The next step is to start adding control points.
The minimum number of control points required to georeference a map typically depends on the transformation method you are using and the complexity of the map. In general, you should aim to use at least three control points, but more control points are advisable for increased accuracy. For this tutorial you will select four control points on the map.
These control points should be added so that they are at different points around the map. In other words, don’t put all of your control points in the lower half of the map or just in the upper right corner. Spread them out across the map. Otherwise you will notice some warping of the scanned map file during the transformation process.
To start adding control points, you need to first zoom in to a section of the scanned map and adjust the view in the map canvas to match. Since the black shaded buildings in the map are the easiest reference points to match with the OpenStreetMap data, use these features.
Zoom into the building that has the extended arms on the scanned map (called “Additional House Office Building) and zoom into the same view of that building on the OpenStreetMap layer.
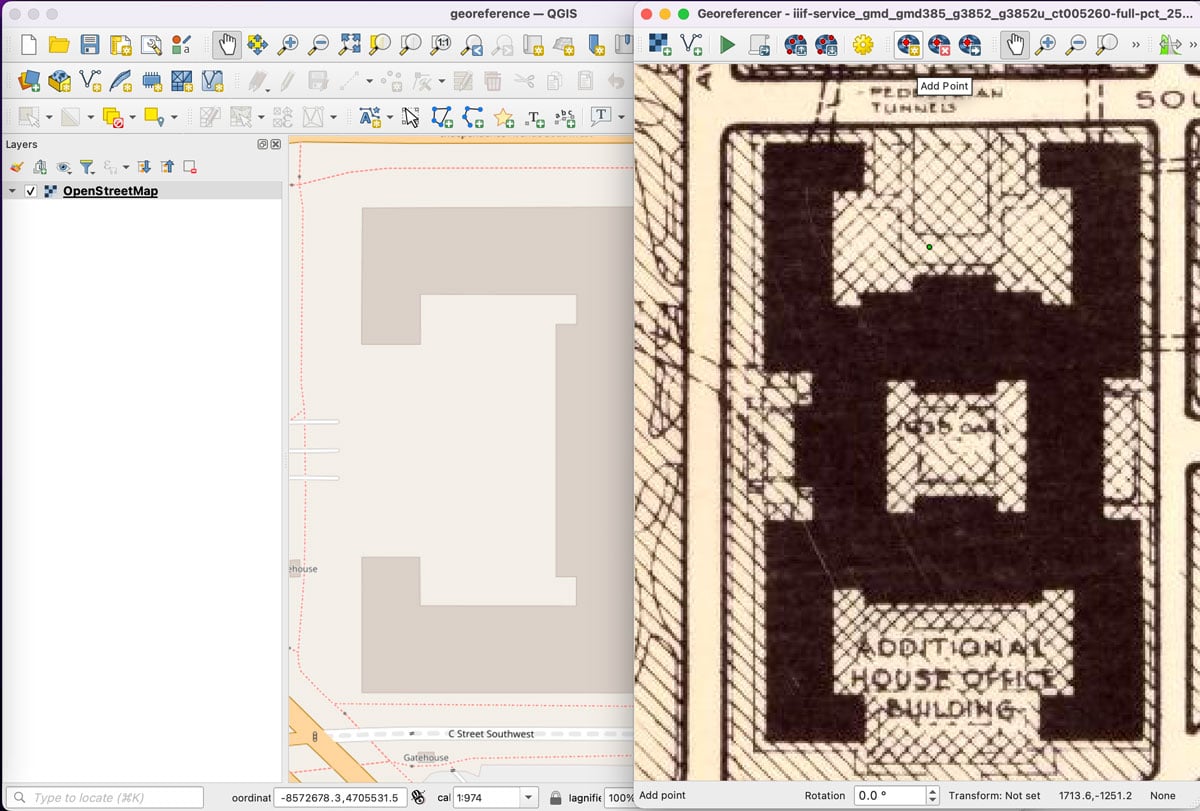
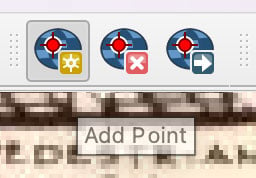
Next click on the “Add Point” icon in the Georeferencer window.
Click on a corner of the building on the scanned map in the Georeferencer window. A window will appear asking you to “Enter Map Coordinates”. Click on the button in the lower left corner with the green pencil icon that says “From Map Canvas.”
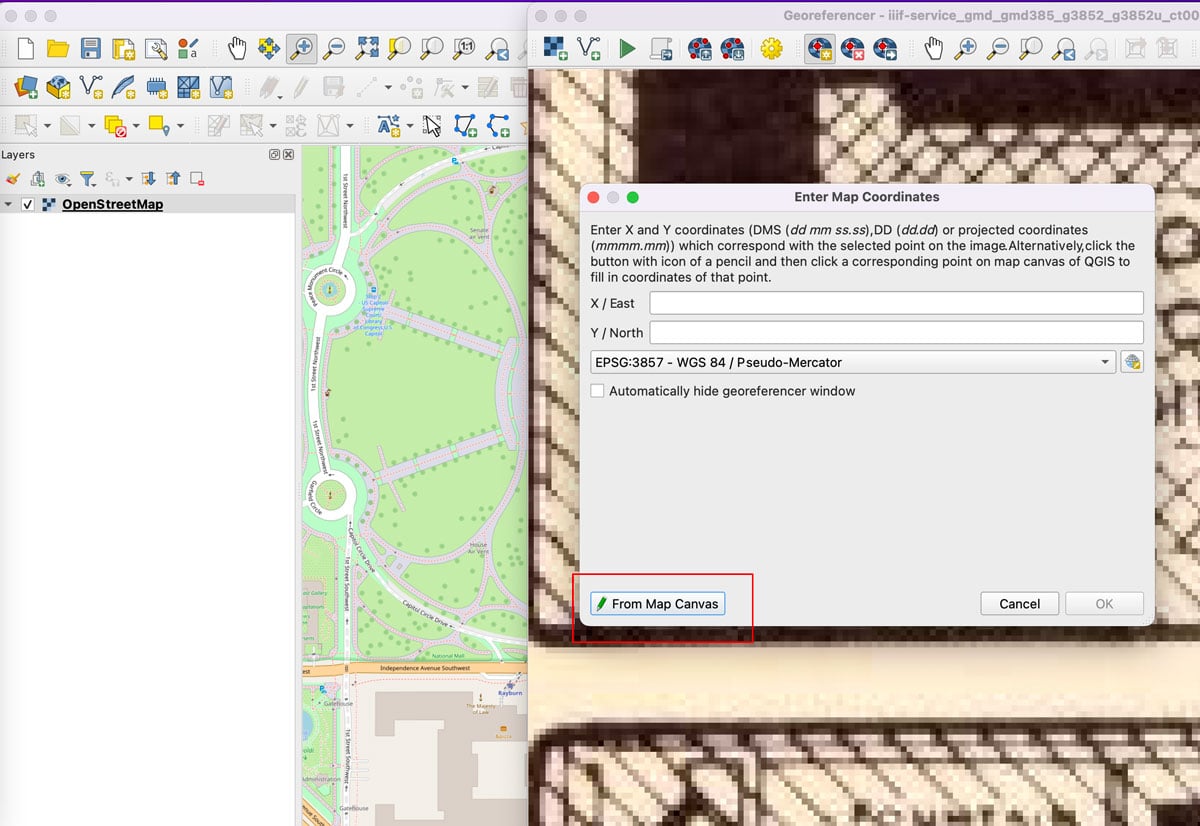
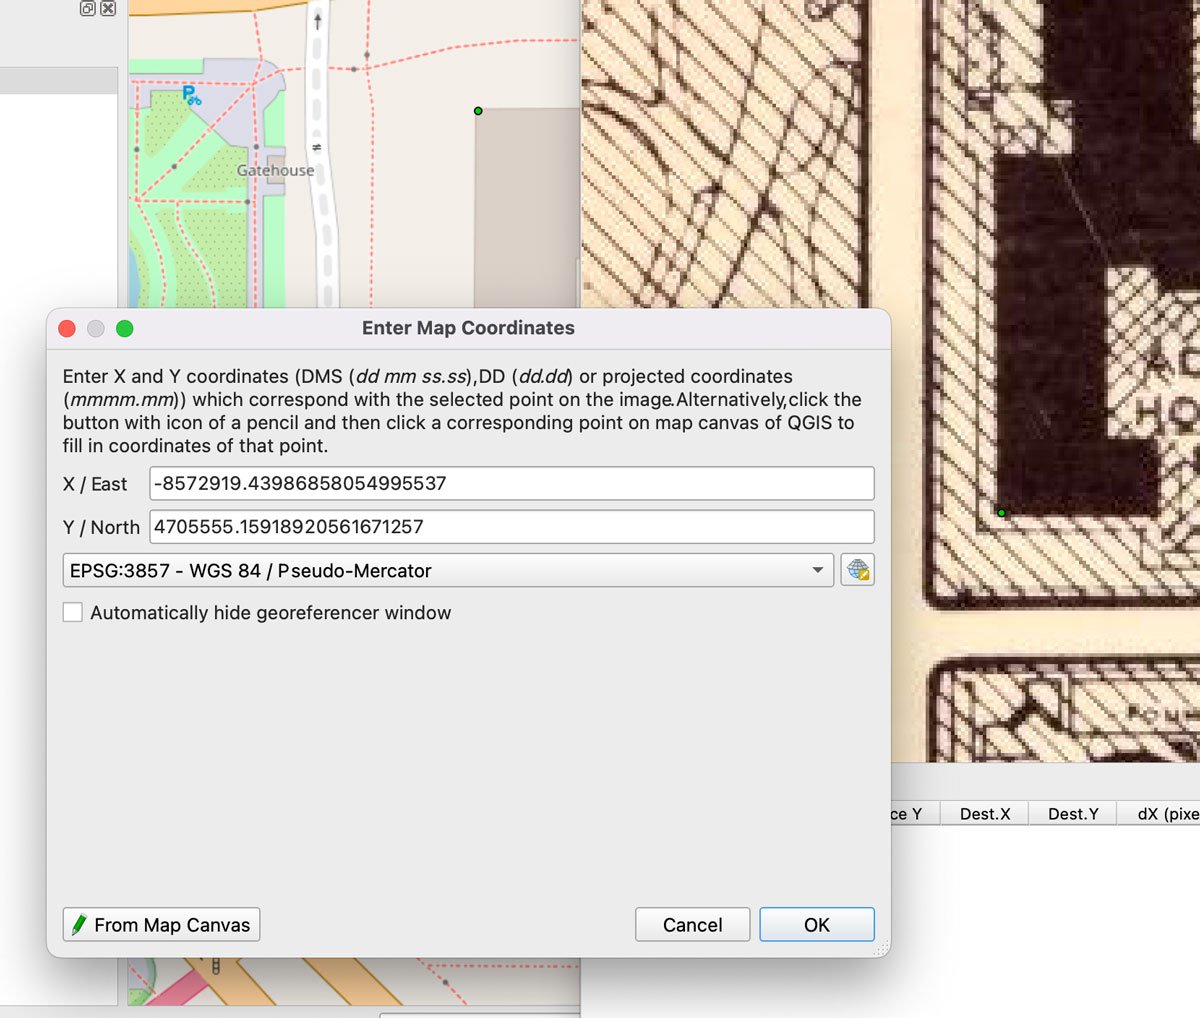
Use your cursor and click on the same corner of the building on the OpenStreetMap layer. The X and Y coordinate boxes in the “Enter Map Coordinates” will automatically populate with the coordinates extracted from the OpenStreetMap layer.
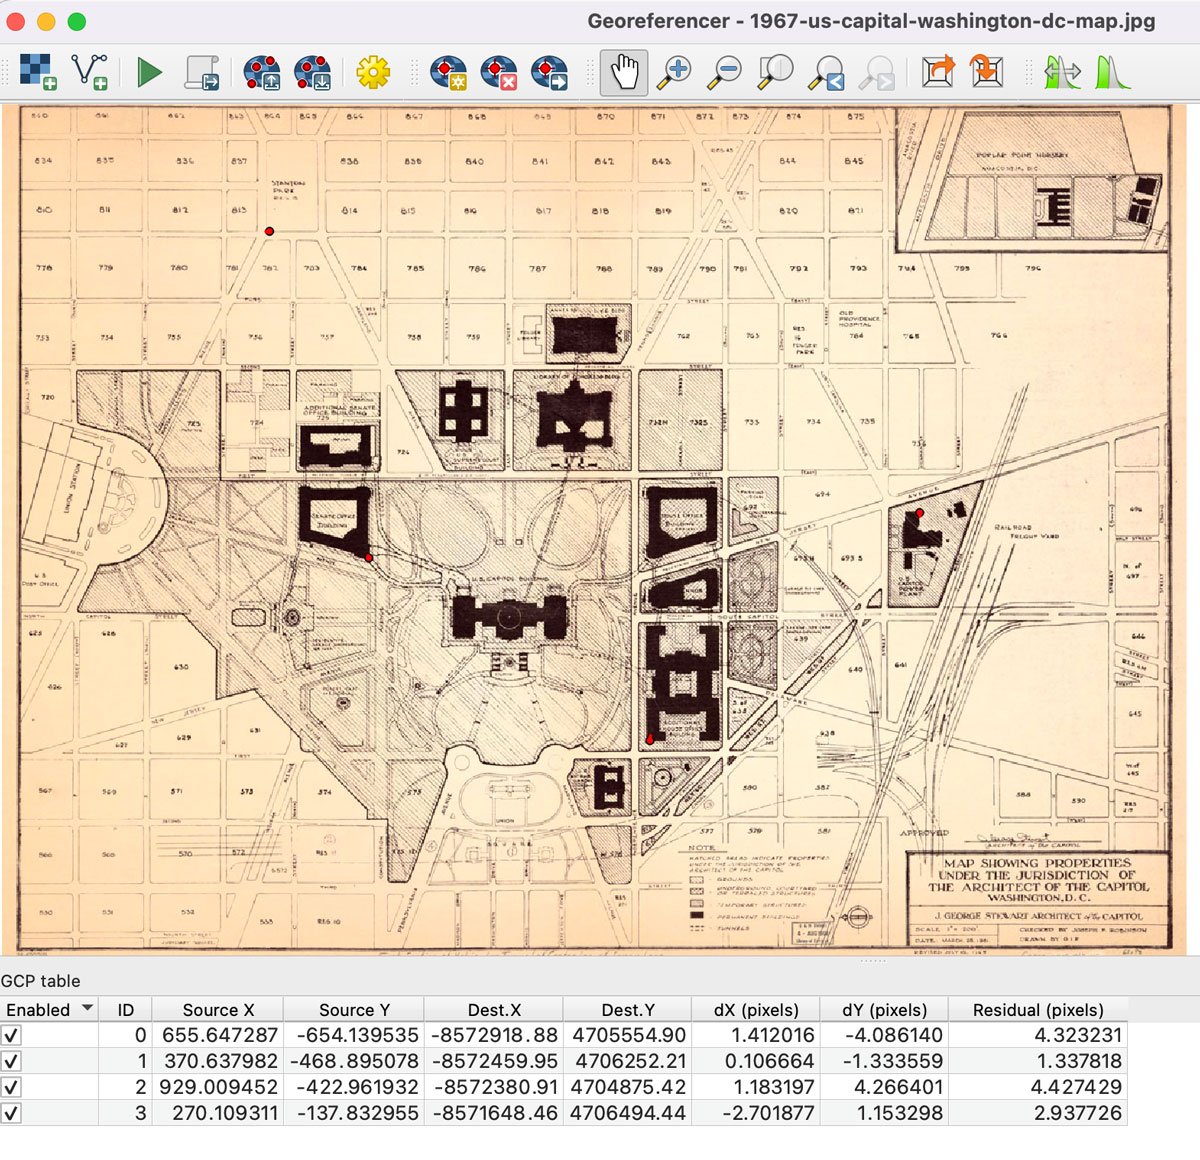
The control point on the map and the corresponding reference point on the OpenStreetMap layer will show as green dots. If you are happy with the two points, click the OK button. The dots will turn red and a row with the control point values will be added below the scanned map in the Georeferencer window.
To set the next control point, pan over to the other side of the U.S. Capital building to the building marked “Senate Office Building” on the scanned map. Set the same view in the map canvas for the OpenStreetMap layer. Repeat the process with adding a control point to the scanned map and the corresponding reference point in the map canvas.
For the third control point, find a corner on the U.S. Capital power plant footprint (middle right section of the map) to link to the same point on the OpenStreet Map layer.
For a fourth and final ground control point, find Stanton Park (upper left section) on the map and place a control point on one of the corners and a corresponding reference point on the OpenStreetMap layer.
How to remove a control point in the Georeferencer window
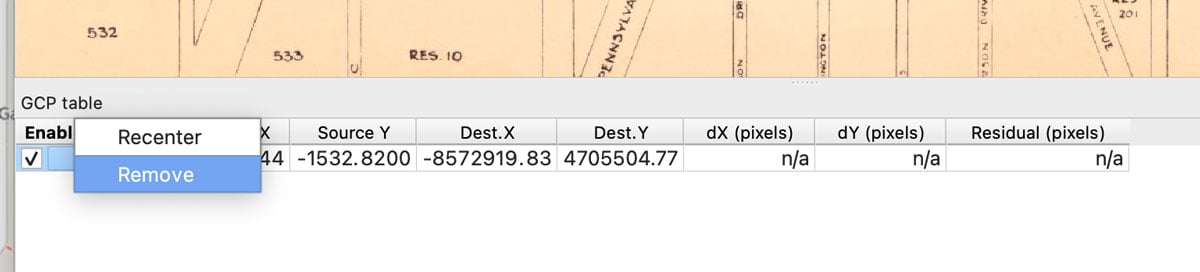
If you place a control point or a reference point in error, you can right click on any of the records below the scanned map and select the “Remove” option. Then go back in and set new control and reference points.
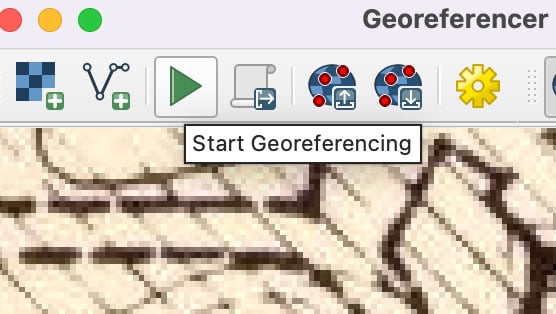
Once you have the minimum number of control points (this will vary depending on the type of transformation you use and the individual conditions of the scanned map), you can start the transformation process by clicking the green start button.
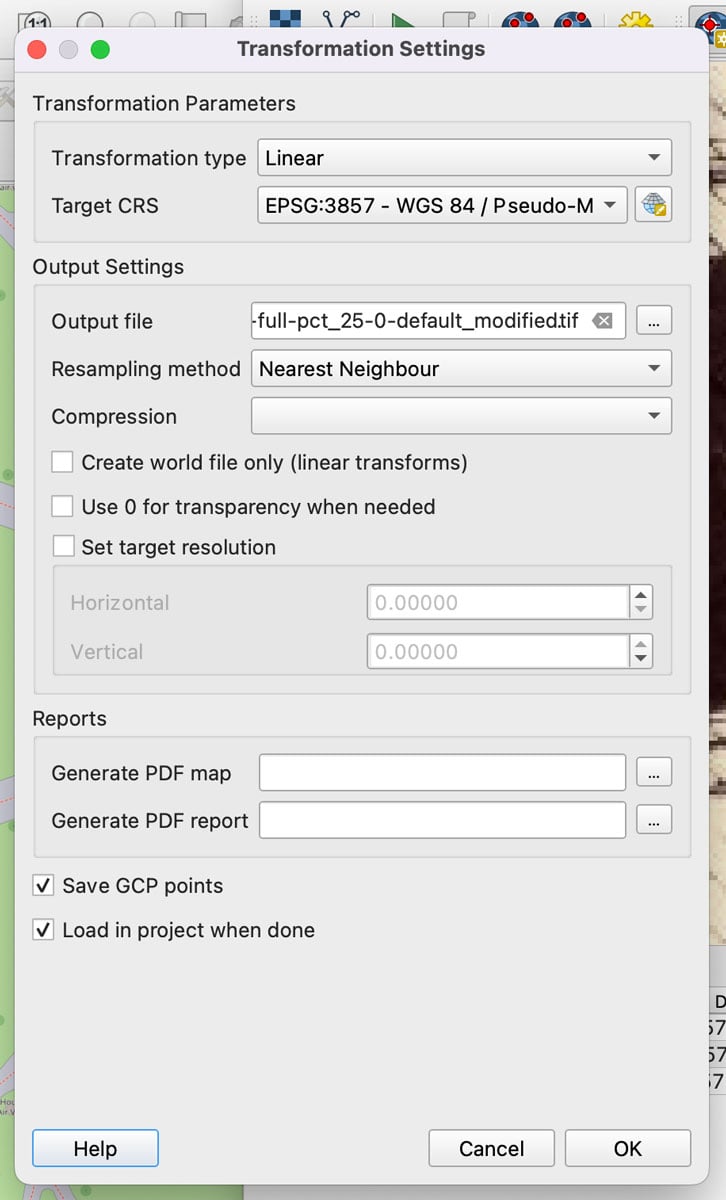
Click past the warning to set the output file name. The next window is the interface where you can set the image transformation settings.
Here you can select the type of transformation – the type of transformation will determine the minimum number of control points you will need to add to the map. You can learn more about these transformation algorithms from the QGIS manual.
You can also set the target coordinate reference system (CRS), give the new georeferenced map image a new name, and set other parameters.
For the purposes of this tutorial, keep all the settings to the default.
Click the OK button to return to the Georeferencing windows. Click the green start button again to start the georeferencing and once completed, the map will be added to the QGIS map canvas.
Note: If your map does not overlay properly and match the underlying OpenStreetMap data, make sure your control/reference pairs are properly placed and that you have enough of them placed in a way that has them spaced out across the extent of the map.
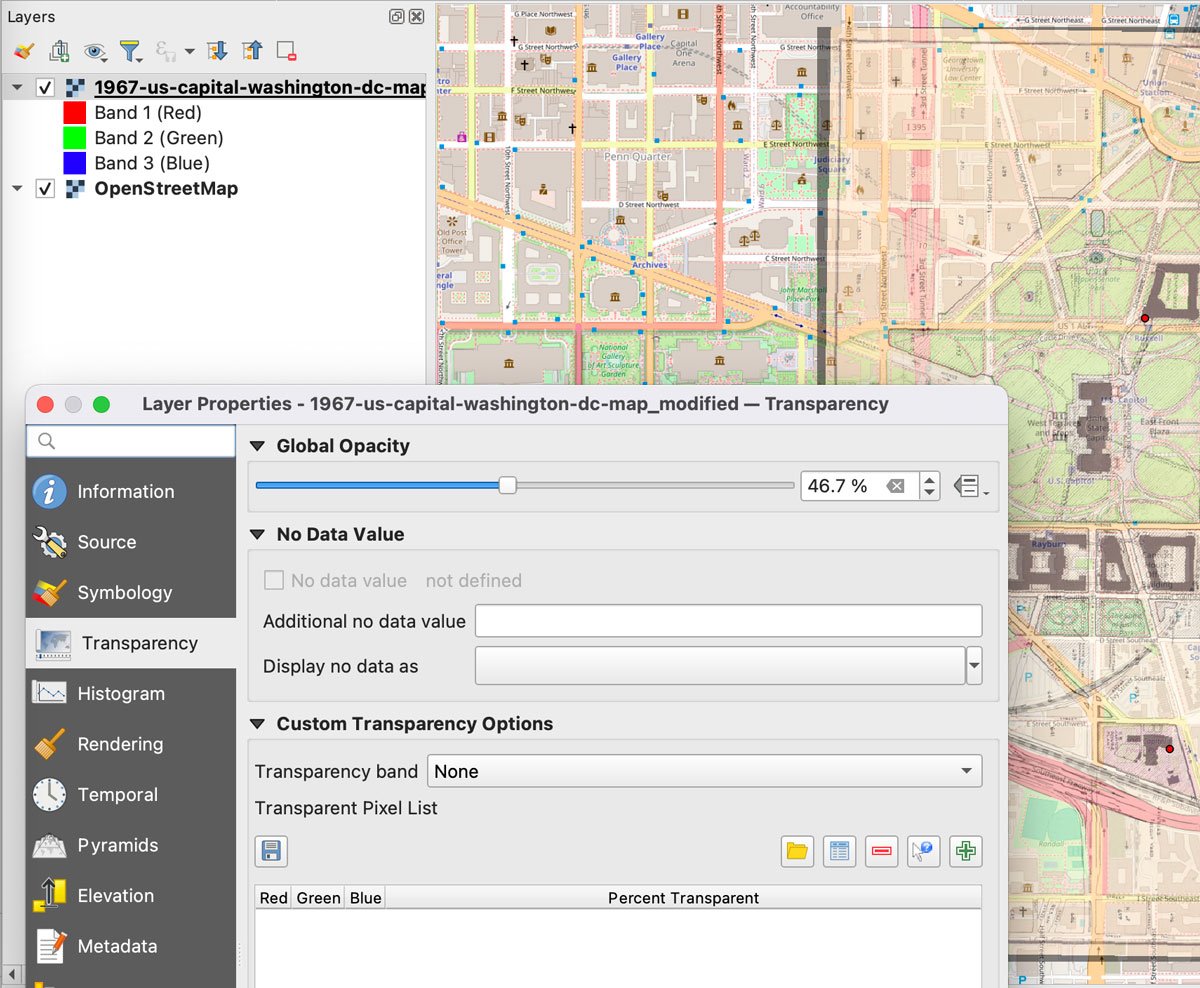
You can adjust the “Global Opacity” settings under the Transparency tab in the layer properties settings to make the scanned map more transparent in order to see the underlying base layer to make sure your map is properly georeferenced.
Here is the result showing the georeferenced scanned map properly aligned with the OpenStreetMap base layer.
More QGIS tutorials
Fonte : National Geographic

: “Creazione del valore oggi ha bisogno di nuovi meccanismi e imprenditori”")
: “Industria acciaio sta lavorando su processo decarbonizzazione”")
: “Progetti offrono risposta creativa a cambiamento climatico”")
: “Epoca di cambiamenti, necessaria nuova generazione di imprenditorialità”")


: “Creazione del valore oggi ha bisogno di nuovi meccanismi e imprenditori”")
: “Industria acciaio sta lavorando su processo decarbonizzazione”")
: “Progetti offrono risposta creativa a cambiamento climatico”")
: “Epoca di cambiamenti, necessaria nuova generazione di imprenditorialità”")
