


GIS data refers to information that is explicitly linked to locations on the Earth’s surface. Alongside this spatial data, there is often attribute data, which provides additional details about the spatial features. This attribute data enhances the spatial information, allowing for a richer analysis and interpretation by connecting specific characteristics to geographic coordinates.
What types of GIS data are there?
GIS data can be separated into two categories: spatially referenced data which is represented by vector and raster forms (including imagery) and attribute tables which is represented in tabular format.
Within the spatial referenced data group, the GIS data can be further classified into two different types: vector and raster.
Most GIS software applications mainly focus on the usage and manipulation of vector geodatabases with added components to work with raster-based geodatabases.
What is the difference between raster and vector GIS data?
As mentioned, geospatial data can be represented in one of two main types: vector or raster.
Vector data is the most common type of GIS data. Most data loaded into a GIS software program tends to be in vector data. Vector data represents geographic data symbolized as points, lines, or polygons.
Raster data represents geographic data as a matrix of cells that each contains an attribute value. While the area of different polygon shapes in a data set can differ, each cell in a raster data set is the same cell. The size of the area in the real world that each cell represents is known as the spatial resolution.
Raster data is most commonly found in remotely sensed data, shaded relief and topographic data, satellite imagery, and aerial imagery.
Vector data
Vector data is split into three types: point, line (or arc), and polygon data.
Point Data
Point data is most commonly used to represent nonadjacent features and to represent discrete data points. Points have zero dimensions, therefore you can measure neither length or area with this dataset.
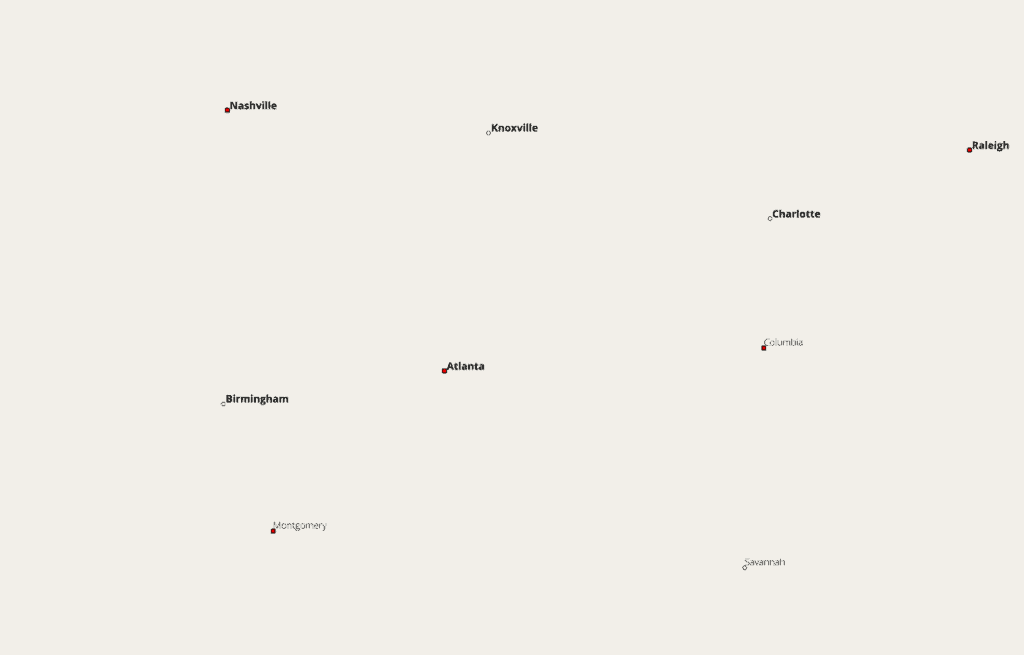
Examples would be schools, points of interest, bridge and culvert locations. Point features are also used to represent abstract points. For instance, point locations could represent city locations or place names.
Line Data
Line (or arc) data is used to represent linear features. Common examples would be rivers, trails, and streets. Line features only have one dimension and therefore can only be used to measure length. Line features have a starting and ending point. Common examples would be road centerlines and hydrology.
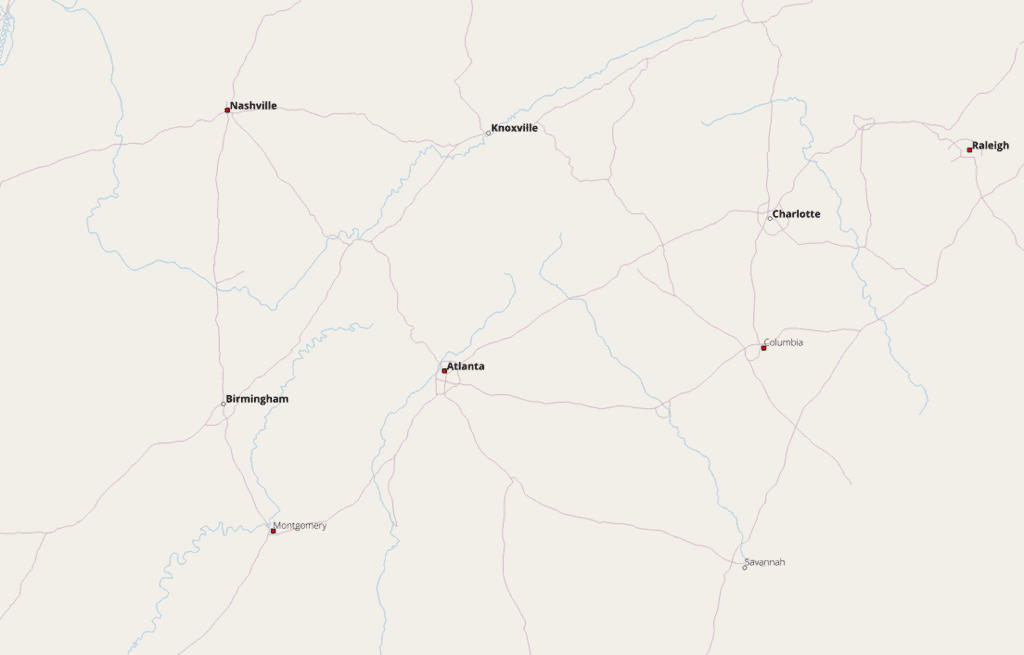
Symbology most commonly used to distinguish arc features from one another are line types (solid lines versus dashed lines) and combinations using colors and line thicknesses. In the example below roads are distinguished from the stream network by designating the roads as a solid black line and the hydrology a dashed blue line.
Polygon Data
Polygons are used to represent areas such as the boundary of a city (on a large scale map), lake, or forest. Polygon features are two dimensional and therefore can be used to measure the area and perimeter of a geographic feature.
Polygon features are most commonly distinguished using either a thematic mapping symbology (color schemes), patterns, or in the case of numeric gradation, a color gradation scheme could be used.
Both line and point feature data represent polygon data at a much smaller scale. They help reduce clutter by simplifying data locations.
As the features are zoomed in to, the point location of a school is more realistically represented by a series of building footprints showing the physical location of the campus.
Line features of a street centerline file only represent the physical location of the street. If a higher degree of spatial resolution is needed, a street curbwidth file would be used to show the width of the road as well as any features such as medians and right-of-ways (or sidewalks).
Quick review: GIS vector data types
Raster data
Cell-based surface GIS data
Raster data (also known as grid data) represents the fourth type of feature: surfaces.
Surface raster data is a type of raster data that represents continuous phenomena or variables that are related to the surface of the Earth. Surface raster data is typically used to model and analyze physical or environmental variables across a landscape such as elevation, slope, aspect, temperature, or precipitation.
Surface raster data is commonly represented by a grid of pixel values that correspond to the values of the variable being measured at each point on the surface.
For example, a surface raster dataset that represents elevation might have a pixel value at each grid location that corresponds to the elevation of that location.
Continuous versus discrete raster data
As mentioned previously, raster data is cell-based containing coordinate information and values for each cell. Cell values can contain information such as the elevation of that cell, the slope, rainfall, or any other surface value that is spread across the geographic region.
Integer versus floating point values in raster data
Raster cell values can be either integer or floating point.
In raster data, floating point refers to a data type that allows for the representation of real numbers with fractional values. Unlike integer data types, which only allow for whole numbers, floating point data can represent values that fall between integer values, such as 3.14 or 5.5.
Floating point raster data is often used in applications that require high precision, such as scientific or engineering simulations, where small variations in values can have a significant impact on the results. It can also be useful in GIS analysis applications that require more precise calculations, such as slope or terrain analysis.
It is important to note that floating point data requires more storage space and processing power than integer data, and it can be more prone to rounding errors and other numerical issues.
The number of cells in a raster data set is dependent upon the geographic extent of the layer and the resolution of the cells.
What are raster GIS data sets used for?
Raster cells are often used to map out surfaces such as topography and can be used to quantity changes across a landscape. Another common use of raster data is as a background layer. Aerials, satellite images, and shaded relief rasters are frequently used as the base layer when making maps.
This data category also includes aerial photographs and satellite imagery. Imagery raster types can be in geoTIFF, TIFF, JPG, PNG, GIF, BMP, and other imagery file formats. These file formats often have a second file called a world file that contains the projection information for the raster imagery.
Continuous and Discrete Raster Data
There are two types of raster data: continuous and discrete.
Discrete raster data
Discrete data values are distinct, separate values that are often categorical or nominal in nature, such as land cover types or land use categories.
Discrete data is typically represented by integer values in raster data, with each unique value representing a different category or class. For example, a raster layer that represents land cover types might assign the value of 1 to forests, 2 to agricultural land, and 3 to urban areas.
Another example of discrete raster data is population density.
Continuous raster data
Continuous data values, on the other hand, are numeric and represent measurements that can take on any value within a range.
Examples of continuous data in raster GIS include elevation or temperature data. Continuous data is typically represented by floating point values in raster data, with each pixel value representing a continuous measurement of the variable being measured.
Three types of raster data
There are also three types of raster datasets: thematic data, spectral data, and pictures (imagery).
Thematic raster data
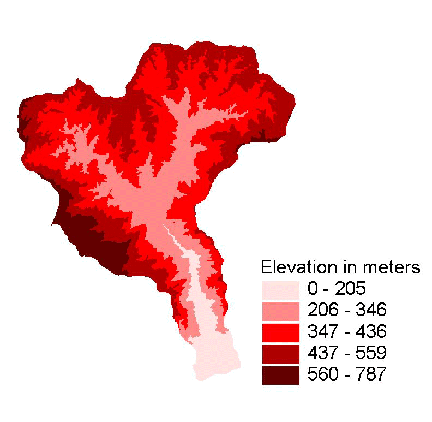
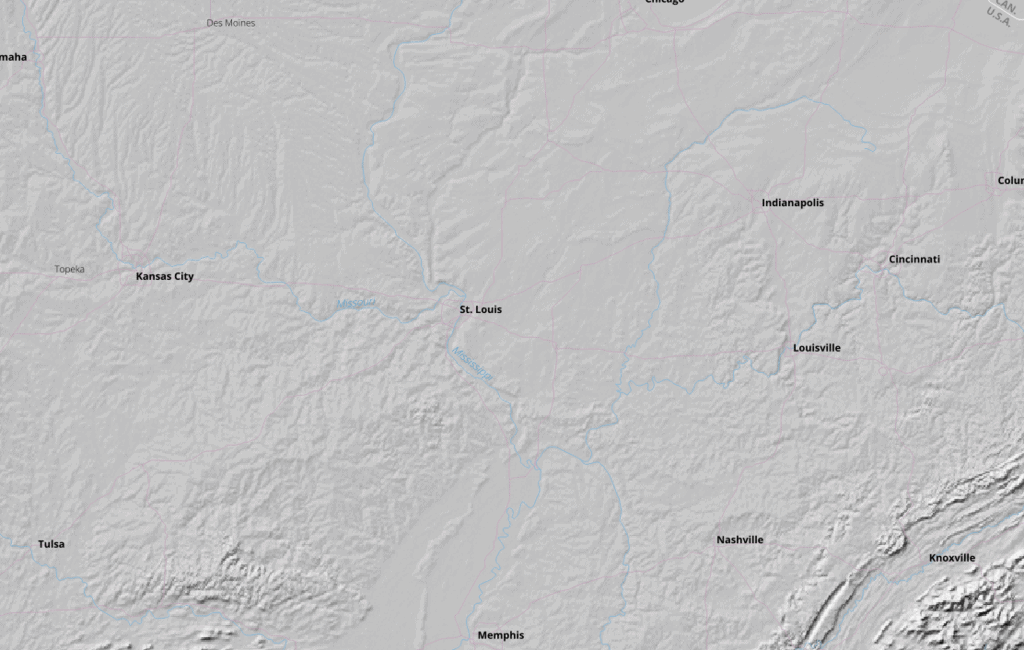
This example of a thematic raster dataset is called a Digital Elevation Model (DEM). Each cell presents a 30m pixel size with an elevation value assigned to that cell.
The area shown is the Topanga Watershed in California and gives the viewer and understand of the topography of the region.
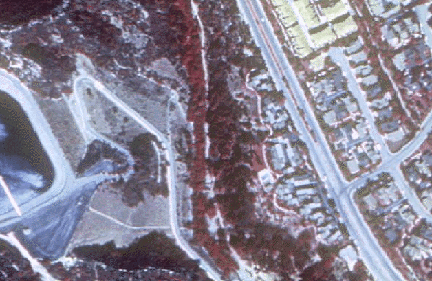
Imagery raster data
Each cell contains one value representing the dominate value of that cell. Raster datasets are intrinsic to most spatial analysis.
Spectral raster data
Spatial hydrology modeling such as extracting watersheds and flow lines also uses a raster-based system.
Spectral data presents aerial or satellite imagery which is then often used to derive vegetation or geologic information by classifying the spectral signatures of each type of feature.
What results from the effect of converting spatial data location information into a cell based raster format is called stairstepping. The name derives from the image of exactly that, the square cells along the borders of different value types look like a staircase viewed from the side.
Unlike vector data, raster data is formed by each cell receiving the value of the feature that dominates the cell. The stairstepping look comes from the transition of the cells from one value to another. In the image above the dark green cell represents chamise vegetation.
This means that the dominate feature in that cell area was chamise vegetation. Other features such as developed land, water or other vegetation types may be present on the ground in that area. As the feature in the cell becomes more dominantly urban, the cell is attributed the value for developed land, hence the pink shading.
Data analysis such as extracting slope and aspect from Digital Elevation Models occurs with raster datasets.
Zoom in close on a raster dataset and you will be able to see the individual cells.
![]()
Raster Images
Aerial and satellite imagery is one type of raster data. Raster image file types include BMP, TIFF, GIF, and JPEG.
Raster images accompanied by a second file known as a world file. The world file has the same name as the raster image file but has a different extension.
The world file is a text file that contains the map projection information needed to properly georeference the raster image.
Sources of GIS Data
GIS data can be obtained from a variety of sources:
- Government Agencies: Many federal, state, and local governments provide GIS data related to topography, land use, infrastructure, and environmental monitoring.
- Commercial Providers: Companies specializing in geographic data offer high-resolution data and specialized datasets like demographic data for marketing analysis.
- Remote Sensing: Data collected from satellite imagery and aerial photography provides up-to-date information about the earth’s surface, useful for monitoring changes in urban development, agriculture, and natural resources.
- Open Source Platforms: Websites like OpenStreetMap offer user-generated GIS data that can be freely used and edited by the public.
This article was originally published on February 11, 2000 and has been since updated.
Fonte : National Geographic


")


